
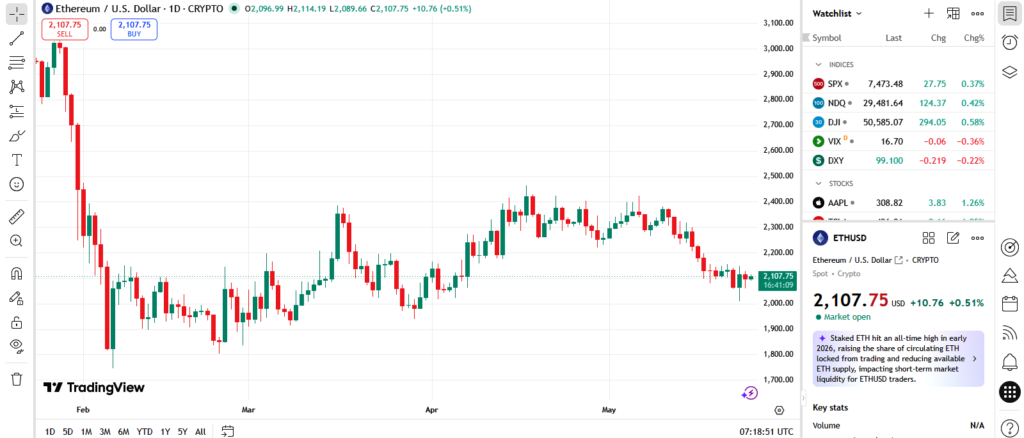
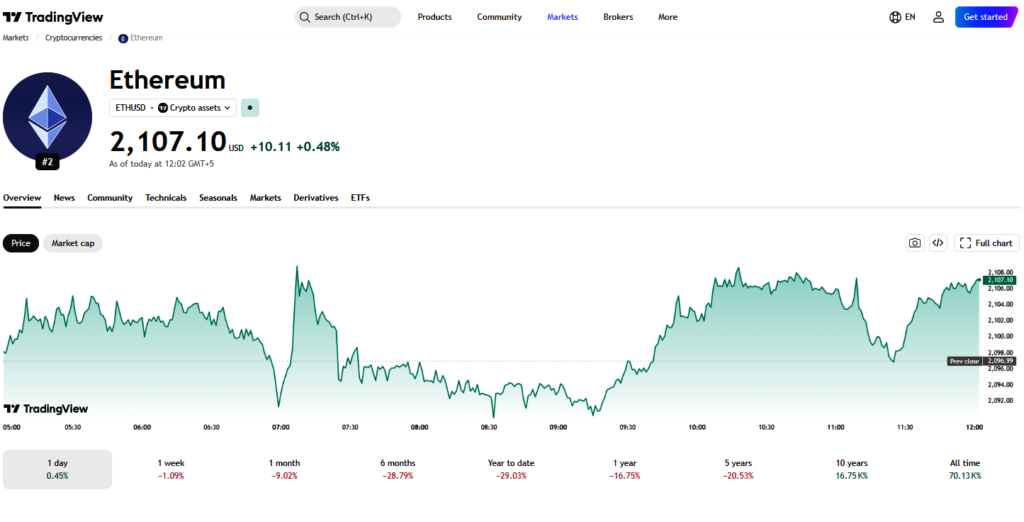
Where Does Ethereum Stand Right Now?

If you had told someone in August 2025 that Ethereum would be trading below $2,400 just nine months later, they probably would have laughed. At its peak, ETH touched $4,953 — a number that felt like the beginning of something much bigger. Yet here we are, in May 2026, with ETH hovering around $2,350 — roughly 53% below that all-time high, and most investors wondering: is this a dead cat bounce, a generational buy, or something in between?
The honest answer is that nobody knows for certain. But what we do know is that the story behind Ethereum’s price in 2026 is far more interesting than the chart suggests. Underneath the surface of a dull-looking consolidation pattern, some of the most transformative upgrades in Ethereum’s history are either live or just weeks away. Institutional money is quietly accumulating. And the supply of liquid ETH on exchanges has fallen to its lowest level in years.
This article breaks down everything you need to understand about the Ethereum price prediction for 2026 — from where the current price stands and why it dropped, to what the world’s most respected analysts are forecasting, to the specific catalysts that could either send ETH soaring or keep it range-bound for the rest of the year.
Whether you are a long-term investor, an active trader, or simply someone trying to understand whether ETH is worth owning at these levels, this guide will give you the most complete and balanced view available — grounded in real data, not hype.
What This Article Covers
- Current Ethereum price snapshot and key on-chain metrics (Section 1)
- Full price history from 2018 to today, including 2025 highs and 2026 correction (Section 2)
- Expert price predictions and institutional forecasts for 2026 (Section 3)
- Month-by-month ETH price forecast for 2026 across three scenarios (Section 4)
- Key bullish catalysts: Glamsterdam upgrade, staking ETFs, supply shock
- Bearish risks and what could derail the recovery
- Long-term ETH price targets through 2030
| Important Disclaimer This article is for informational and educational purposes only. Nothing written here constitutes financial or investment advice. Cryptocurrency markets are highly volatile. Always do your own research before making any investment decisions. |
Ethereum Key Metrics Snapshot (May 2026)
| Metric | Value / Detail |
| Current Price (May 2026) | ~$2,350 |
| All-Time High | $4,953 (August 24, 2025) |
| % Below ATH | –53.0% |
| 2026 Low | $1,800 (February 2026) |
| ETH Staked | ~30% of total supply (~35.8M ETH) |
| Active Validators | ~1.1 million |
| Spot ETF Net Inflows | $11.6 billion cumulative |
| Exchange Supply | 14.9M ETH — at yearly low |
| Market Cap Rank | #2 (behind Bitcoin) |
| Next Major Upgrade | Glamsterdam (targeting June 2026) |
Sources: CoinGecko, MEXC Research, Phemex Blog, LiteFinance (May 2026 data)
Ethereum Price History — From $81 to $4,953 and Back
To understand where Ethereum is going in 2026, you first need to understand where it has been. ETH’s price history is not a simple upward line — it is a series of explosive bull runs, gut-wrenching corrections, and quiet accumulation periods that consistently rewarded patient holders over time.
2.1 — The Early Years: Establishing Value (2015–2020)
Ethereum launched in 2015 at fractions of a dollar. By 2018, it had reached its then-all-time high of approximately $1,432, fueled by the ICO boom and speculative frenzy. What followed was one of the most brutal bear markets in crypto history — ETH crashed all the way to $81.20 in December 2018, wiping out more than 94% of its peak value. Many declared it dead.
They were wrong. The 2018 crash, painful as it was, laid the groundwork for something more sustainable. Developers kept building. The DeFi ecosystem began to take shape. And between 2019 and 2020, a quiet but significant accumulation phase set the stage for the next explosion.
2.2 — The 2021 Bull Market: ETH Finds Its Narrative
In 2021, Ethereum had a breakout year that surprised even its most devoted supporters. ETH climbed from roughly $730 at the start of the year to an all-time high of $4,891 in November 2021, representing a gain of over 560% in a single year. More importantly, Ethereum outperformed Bitcoin by nearly 400 percentage points — a fact that fundamentally changed how institutions viewed the asset.
The narrative driving this rally was clear: Ethereum was not just a cryptocurrency. It was programmable money — the infrastructure layer for decentralized finance, NFTs, and a new generation of internet applications. Every dollar locked in DeFi protocols, every NFT sold on OpenSea, every stablecoin transaction processed on Ethereum was a real-world validation of its utility.
2.3 — The Merge and the Road to 2025
September 2022 marked one of the most technically ambitious events in blockchain history: The Merge. Ethereum transitioned from energy-intensive Proof-of-Work to Proof-of-Stake, reducing the network’s energy consumption by over 99%. It was a feat that skeptics had called impossible for years.
Ironically, the market did not immediately reward this achievement. Ethereum entered a prolonged bear market through most of 2022 and 2023, with prices falling as low as $879 amid the broader crypto winter triggered by the collapse of Terra/Luna and FTX. But the fundamentals continued improving. The Shapella upgrade in April 2023 allowed staked ETH withdrawals for the first time, removing a key uncertainty from the market. The Dencun upgrade in early 2024 dramatically reduced Layer 2 transaction costs.
By 2024 and into 2025, Ethereum had new rocket fuel: spot ETF approvals. The launch of spot Ethereum ETFs in the United States brought institutional-grade access to ETH for the first time, unlocking billions in fresh capital. Combined with the Pectra upgrade (May 2025) and the Fusaka upgrade (December 2025), ETH surged to its new all-time high of $4,953 on August 24, 2025.
2.4 — The 2026 Correction: Why Did ETH Drop?
After the August 2025 peak, Ethereum entered a significant correction phase. By February 2026, ETH had fallen back below $1,800 — a drop of over 63% from the all-time high. This correction shocked many investors who had expected the bull market to continue indefinitely.
Several factors contributed to the pullback. Broader macroeconomic uncertainty weighed on risk assets globally. Bitcoin dominance increased as capital rotated back to perceived safety. And a persistent narrative emerged that Ethereum’s Layer 2 ecosystem — while technically impressive — was siphoning fee revenue away from Ethereum mainnet, weakening the deflationary ETH story. The ETH/BTC ratio, which measures Ethereum’s performance relative to Bitcoin, fell to multi-year lows.
Since February 2026, Ethereum has stabilized and begun recovering, currently trading around $2,350. Exchange supply has hit yearly lows, on-chain whale accumulation is visible, and the most anticipated upgrade since the Merge — Glamsterdam — is just around the corner.
Ethereum Year-by-Year Price Summary (2018–2026)
| Year | Low | High | Key Events / Catalysts |
| 2018 | $81 | $1,432 | ICO boom collapse; bear market begins |
| 2019 | $102 | $366 | DeFi summer early signs; quiet recovery |
| 2020 | $113 | $748 | DeFi explosion; Uniswap, Compound launch |
| 2021 | $730 | $4,891 | NFT boom; ETH outperforms BTC by +400% |
| 2022 | $879 | $3,576 | The Merge (Sept 2022); FTX collapse bear market |
| 2023 | $1,196 | $2,139 | Shapella unstaking upgrade; recovery begins |
| 2024 | $2,200 | $4,093 | Spot ETF launch; Dencun upgrade; institutional entry |
| 2025 | $1,800 | $4,953 ★ | Pectra + Fusaka upgrades; GENIUS Act; new ATH |
| 2026 (YTD) | $1,800 | ~$2,500 | Glamsterdam incoming; staking ETFs launch; recovery phase |
★ All-Time High as of May 2026. Sources: CoinGecko historical data, LiteFinance, InvestingHaven
Ethereum Price Prediction 2026 — What the Experts Say
One of the most striking things about Ethereum price predictions for 2026 is the sheer width of the forecast range. From a cautious $2,000 bear case to an aggressive $12,000 bull case, serious analysts are literally poles apart. That is not unusual for a volatile asset — but the magnitude of disagreement here reflects genuinely different views on macro conditions, regulatory timelines, and how quickly the Glamsterdam upgrade can change the market narrative.
Understanding these forecasts requires more than just reading the numbers. It requires understanding the assumptions and reasoning behind each projection. Below, we walk through the major predictions — from the most conservative institutional estimates to the most bullish analyst calls — and explain exactly what each view is betting on.
3.1 — Institutional Forecasts: The Conservative Anchors
Citigroup — $3,175 Base Case
Citigroup, one of the largest investment banks in the world, has pegged its base-case Ethereum target at $3,175 for 2026. The Citi forecast reflects a relatively cautious institutional outlook: ETH will recover from its 2026 correction, but meaningful upside will be constrained by ongoing macroeconomic headwinds, a still-developing regulatory framework in the United States, and the continued erosion of mainnet fee revenue by Layer 2 networks.
Citi’s view is arguably the most grounded in near-term fundamentals. It does not rely on speculative catalysts or extraordinary market conditions — just a moderate re-rating as the asset class matures and ETF inflows continue at a steady pace.
Fundstrat — $4,500 Target
Fundstrat’s internal research team has set a 2026 target of $4,500 for Ethereum. This forecast sits comfortably in the middle ground — above Citi’s cautious call, but well below the most optimistic projections. Fundstrat’s reasoning centers on institutional demand continuation, the positive market impact of staking-enabled ETFs, and Ethereum’s role as the primary smart contract infrastructure for an increasingly tokenized financial system.
Fundstrat has historically been more willing than traditional banks to assign positive value to Ethereum’s utility premium — the additional value derived from the fact that ETH is not just a speculative asset, but a productive one that generates staking yield.
3.2 — The Bull Case: Where the Big Targets Come From
Standard Chartered — $7,500 Year-End Target
Standard Chartered has been one of the most consistently bullish major institutions on Ethereum. Their current forecast calls for ETH to reach $7,500 by year-end 2026 — more than three times the current price. This target is predicated on several conditions aligning: the Glamsterdam upgrade delivering its promised 10x throughput improvement, continued institutional accumulation via staking ETFs, and a broader crypto market recovery led by Bitcoin breaking to new all-time highs.
Standard Chartered’s analysts specifically highlight the staking ETF dynamic as a structural bullish driver. When regulated funds can offer investors yield-bearing exposure to ETH — similar to how bond funds work — the addressable market for Ethereum investment expands dramatically beyond pure crypto-native investors.
Jeremy Britton (BostonTrading) — $9,000
Jeremy Britton, founder and CFO of BostonTrading Co., projects ETH reaching $9,000 in 2026. His thesis is rooted in what he calls Ethereum’s ‘digital oil’ characteristics — the idea that ETH is not merely a store of value, but a consumable resource that powers the global decentralized economy. As on-chain activity scales through Glamsterdam’s improved infrastructure, demand for ETH as gas should increase structurally, supporting higher prices.
Britton places significant weight on network effects — the same dynamic that makes Google’s search engine and Amazon’s marketplace exponentially more valuable as they grow. Ethereum’s developer community, DeFi liquidity, and dApp ecosystem represent a moat that competing blockchains have not meaningfully breached.
Tom Lee (Fundstrat) — $12,000 Base Case
Tom Lee, Fundstrat’s managing partner and one of the most widely followed voices in crypto, has stated a $12,000 base case for ETH in 2026 with an even higher upside scenario. Lee’s framework combines technical cycle analysis with fundamental value drivers: post-halving Bitcoin momentum lifting the entire crypto market, Ethereum’s improving fundamentals relative to its current deeply discounted valuation, and the catalytic effect of institutional ETF products reaching critical mass.
It is worth noting that Lee has acknowledged his bullish timeline has ‘kept stretching’ — his targets have been correct in direction more often than in timing. Investors following this view should understand they may need patience before the market validates these levels.
3.3 — The Bear Case: When Things Go Wrong
Alexander Kuptsikevich (FxPro) — $2,000
Not all analysts are optimistic. Alexander Kuptsikevich, chief market analyst at FxPro, believes the market has entered bear mode and projects ETH hovering around $2,000 through much of 2026. His concern centers on macro deterioration — a potential recession scenario where risk assets broadly sell off, crypto included — and the ongoing weakness in the ETH/BTC ratio that suggests capital is preferring Bitcoin over Ethereum in the current cycle.
The bear case is not about Ethereum’s technology failing. It is about the broader financial environment being unfavorable for risk-on assets, and Ethereum being particularly sensitive to that environment given its higher beta relative to Bitcoin.
Expert & Institutional ETH Price Predictions 2026 (Full Comparison)
| Analyst / Institution | Price Target | Scenario | Key Assumption |
| Alexander Kuptsikevich — FxPro | $2,000 | Bear | Macro recession; ETH/BTC ratio weakness continues |
| InvestingHaven | $1,800–$3,500 | Conservative | Market sentiment dependent; $3,500 requires favorable conditions |
| Citigroup | $3,175 | Base | Steady institutional adoption; moderate ETF inflows |
| LiteFinance | $3,210 | Base | Consolidation above $3,000; technical breakout |
| Fundstrat Research | $4,500 | Base–Bull | Staking ETFs + institutional demand; utility premium |
| Changelly | $4,565–$5,201 | Base | Historical pattern analysis + technical indicators |
| NAGA Markets | $7,000–$10,000 | Bull | Glamsterdam adoption; DeFi institutional integration |
| Standard Chartered | $7,500 | Bull | Staking ETF flows + Glamsterdam upgrade on schedule |
| Jeremy Britton — BostonTrading | $9,000 | Bull | ‘Digital oil’ thesis; network effect dominance |
| Tom Lee — Fundstrat | $12,000 | Extreme Bull | Full cycle peak; institutional ETFs at scale; BTC ATH catalyst |
Sources: CoinGecko, MEXC Research, InvestingHaven, Zipmex, Phemex Blog, LiteFinance (May 2026)
| Key Takeaway — Section 3 The defensible base case for ETH in 2026 sits between $3,500 and $5,000. The bull case of $7,500 or higher requires the Glamsterdam upgrade to land on schedule AND institutional demand to accelerate meaningfully. A path to $10,000+ exists but requires multiple catalysts aligning simultaneously. |
ETH Monthly Price Forecast 2026 — Quarter by Quarter
Understanding the annual forecast range is useful, but investors and traders typically want something more granular: what might ETH actually do month-by-month through the rest of 2026? This section breaks down the most likely price progression across three scenarios — bear, base, and bull — grounded in the specific events and catalysts expected in each quarter.
It is critical to read these projections as probability-weighted ranges, not precise predictions. Crypto markets are notoriously sensitive to sudden macro shifts, regulatory announcements, and unexpected technical developments. These figures should be used as a framework for thinking about positioning, not as certainties.
4.1 — Q1 2026 (January–March): Finding the Floor
The first quarter of 2026 was defined by the aftermath of the post-ATH correction. Ethereum briefly touched $1,800 in February — a level that proved to be a significant structural support, coinciding with the 200-week moving average and a historically reliable accumulation zone. Institutional buyers quietly absorbed the selling pressure.
March saw the first signs of stabilization. Grayscale filed for — and later launched — its staking-enabled ETH ETF on NYSE Arca in early April, signaling growing regulatory comfort with Ethereum staking products. Exchange supply began trending down as holders moved coins to staking contracts and cold storage rather than preparing to sell.
| Q1 2026 Summary Bear: $1,800–$2,000 | Base: $2,000–$2,500 | Bull: $2,500–$3,200 Key Events: ETH dips to $1,800 support (Feb); Grayscale staking ETF filing; whale accumulation begins. |
4.2 — Q2 2026 (April–June): The Glamsterdam Catalyst
Q2 2026 is the most pivotal quarter of the year for Ethereum. The Glamsterdam hard fork — Ethereum’s most consequential upgrade since The Merge — is targeting a June 2026 mainnet launch. The upgrade introduces parallel transaction processing via Block-Level Access Lists (BALs), Enshrined Proposer-Builder Separation (ePBS), and a gas repricing mechanism that is expected to reduce transaction costs by approximately 78%.
The market has historically priced in major Ethereum upgrades in advance, with a ‘buy the rumor, sell the news’ dynamic sometimes playing out. However, Glamsterdam is different in scale from previous upgrades — it targets a 10x improvement in Layer 1 throughput, from roughly 1,000 TPS today to 10,000 TPS post-upgrade. This is the kind of transformation that changes Ethereum’s competitive positioning meaningfully, not just at the margins.
April also saw BlackRock’s ETHB — a staked ETH ETF that distributes yield to shareholders — begin accumulating assets, with its first day of trading pulling in over $100 million in inflows. This product represents a new category of institutional demand: not just exposure to ETH price, but yield-bearing exposure that competes directly with corporate bonds and dividend-paying equities.
| Q2 2026 Summary Bear: $2,000–$2,500 | Base: $2,500–$3,500 | Bull: $3,500–$5,000 Key Events: BlackRock ETHB staking ETF launches (April); Glamsterdam mainnet (June target); ETF weekly inflows avg $180M post-upgrade. |
4.3 — Q3 2026 (July–September): Post-Upgrade Momentum
If Glamsterdam launches on schedule and performs as expected, Q3 2026 could be when the upgrade’s real-world impact becomes visible on-chain. The Ethereum network would be processing all-time high daily transaction volumes at historically low gas fees — a combination that makes the network genuinely more accessible for developers, DeFi users, and enterprises considering on-chain settlement.
Historically, the three to six months following a major Ethereum upgrade have been strong for price performance. After The Merge in September 2022, ETH’s fundamental story strengthened significantly — though macro headwinds prevented an immediate price rally. After Dencun in early 2024, ETH recovered strongly over the following quarters. Glamsterdam represents a much larger fundamental improvement than either of those upgrades.
Q3 is also typically when Bitcoin’s post-halving cycle (the halving occurred in April 2024) produces its strongest broad market tailwinds. If history rhymes — and there is no guarantee it will — this could be the quarter where ETH begins outperforming Bitcoin again, helping to repair the damaged ETH/BTC ratio that has concerned many institutional investors.
| Q3 2026 Summary Bear: $2,200–$3,000 | Base: $3,200–$5,000 | Bull: $5,000–$7,000 Key Events: Glamsterdam post-upgrade adoption; ATH daily transactions on Ethereum L1; Q3 BTC cycle tailwinds; ETH/BTC ratio recovery attempt. |
4.4 — Q4 2026 (October–December): The Year-End Question
The final quarter of 2026 is where forecasts diverge most dramatically. 1 In the bear scenario, persistent macro weakness and profit-taking after the Glamsterdam rally leave ETH consolidating between $2,500 and $3,000. In the base case, year-end institutional rebalancing and continued ETF inflows push prices into the $4,000–$5,500 range. In the bull scenario, a full market cycle peak drives ETH toward Standard Chartered’s $7,500 target or beyond.
The Hegotá upgrade — Ethereum’s next scheduled hard fork after Glamsterdam, targeting the second half of 2026 — could provide an additional catalyst if it lands in Q4. Hegotá focuses on further Layer 2 scaling improvements and enhanced network efficiency, building on the foundation Glamsterdam establishes.
December Ethereum
December is also when algorithmic models and historical pattern analysis tend to be most bullish for Ethereum. The combination of year-end portfolio rebalancing, the four-year cycle model, and typically higher retail participation during the holiday season has historically created favorable conditions for late-year crypto price increases.
| Q4 2026 Summary Bear: $2,500–$3,000 | Base: $4,000–$5,500 | Bull: $6,000–$7,500+ Key Events: Hegotá upgrade (potential H2 2026); year-end institutional rebalancing; ETF AUM milestones; full cycle assessment. |
Ethereum Monthly Price Forecast 2026: Bear / Base / Bull Scenarios
| Period | Bear Case | Base Case | Bull Case | Key Catalyst |
| Jan 2026 | $1,900–$2,100 | $2,100–$2,400 | $2,400–$2,900 | Post-ATH stabilization |
| Feb 2026 | $1,800 (low) | $1,900–$2,200 | $2,200–$2,700 | Support test; whale accumulation |
| Mar 2026 | $1,900–$2,200 | $2,200–$2,600 | $2,600–$3,400 | Grayscale ETF filing |
| Apr 2026 | $2,000–$2,300 | $2,400–$2,900 | $3,000–$4,000 | BlackRock ETHB launches |
| May 2026 | $2,000–$2,400 | $2,300–$3,000 | $3,200–$4,500 | Glamsterdam anticipation |
| Jun 2026 | $2,100–$2,600 | $2,800–$3,600 | $4,000–$5,500 | Glamsterdam mainnet ★ |
| Jul 2026 | $2,200–$2,700 | $3,000–$4,000 | $4,500–$6,000 | Post-upgrade adoption |
| Aug 2026 | $2,200–$2,800 | $3,200–$4,500 | $5,000–$6,500 | ATH tx volumes on L1 |
| Sep 2026 | $2,000–$2,800 | $3,000–$4,500 | $5,500–$7,000 | BTC cycle tailwinds |
| Oct 2026 | $2,200–$2,800 | $3,500–$4,800 | $5,500–$7,000 | Institutional Q4 flows |
| Nov 2026 | $2,200–$2,900 | $3,800–$5,200 | $6,000–$7,500 | Hegotá upgrade (potential) |
| Dec 2026 | $2,500–$3,000 | $4,000–$5,500 | $6,500–$7,500+ | Year-end target zone |
★ Glamsterdam mainnet date is approximate; subject to testnet validation. These forecasts are not financial advice.
4.5 — What Would It Take for Each Scenario to Play Out?
Scenario Conditions: What Needs to Happen for Each Case
| Factor | Bear Case ($2,500–$3,000) | Base Case ($4,000–$5,500) | Bull Case ($6,500–$7,500+) |
| Macro | Recession; risk-off; rate hikes resume | Soft landing; rates stable or falling | Strong growth; loose monetary policy |
| Glamsterdam | Delayed or underwhelming delivery | On time, broadly adopted over 6 months | On time + immediate DeFi adoption surge |
| ETF Flows | Stagnant or net outflows | $100M–$300M weekly inflows sustained | $500M+ weekly; BTC ETF rotation into ETH |
| ETH/BTC | Ratio continues declining; BTC dominates | Ratio stabilizes; modest ETH outperformance | Full ratio recovery to 2021 levels |
| Regulation | DeFi crackdown; staking restrictions | Clarity continues; no major restrictions | Explicit DeFi-friendly framework passed |
This framework should be used dynamically — as conditions evolve through 2026, the scenario probabilities shift. Watching ETF flow data, Glamsterdam testnet progress, and macro indicators will give you the earliest signal of which scenario is playing out.
| Key Takeaway — Section 4 June 2026 is the single most important month to watch. A successful Glamsterdam launch with strong post-upgrade adoption is the fulcrum point that separates the base case ($4,000–$5,500 year-end) from the bear case ($2,500–$3,000). Watch Glamsterdam testnet updates and ETF weekly flow data as your leading indicators. |

Nice 👍 bro